Introduction
In this stage, I will try to find out with function takes most CPU resources and see if there is possibility to reduce the runtime without effect or with a tiny effect to the output.
I choose “gprof” as the profiler on Linux machine. The reason why I choose it is that it gives me a option to see the call times of the function.
First, I need to add -pg argument when I am compiling the program:
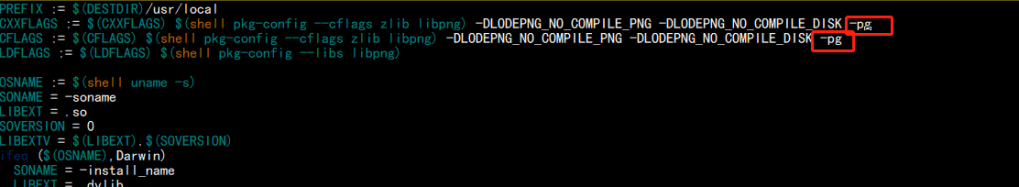
This allows “gprof” to count the call times of the function calls.
Then I compile and run the program, I get a file called “gmon.out”.
Run “gprof flif gmon.out > result.txt”, I redirect the output of the result to the file so I can clearly see the report:
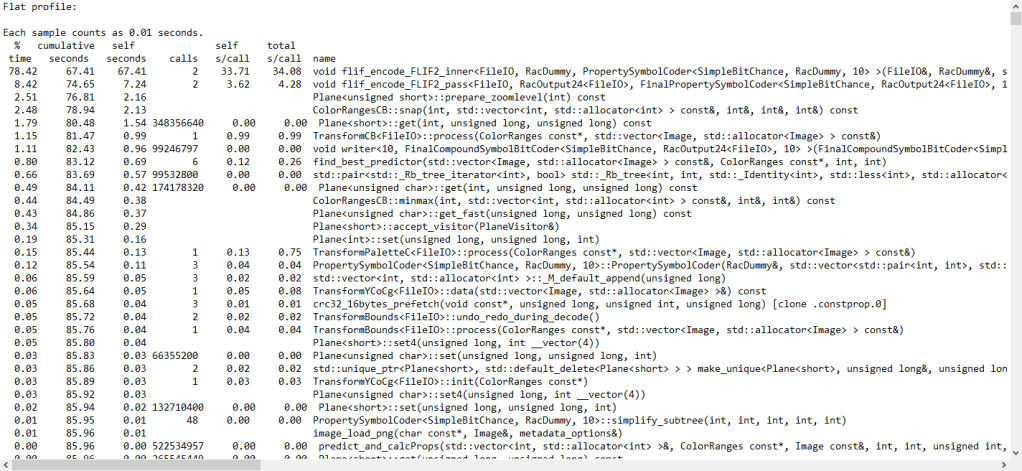
In FLIF project, most of CPU time of costed by encode functions: flif_encode_FLIF2_inner and void flif_encode_FLIF2_pass
They take approximately 87% of the run time when I try to compress a 8K image.
Then I locate the function and see how it works.
This function contains many nested loops and run the loop in a single thread. This could be a point that how can I speed up the project – multiple threading and inline assembly.
