Be yourself; Everyone else is already taken.
— Oscar Wilde.
This is the first post on my new blog. I’m just getting this new blog going, so stay tuned for more. Subscribe below to get notified when I post new updates.
Be yourself; Everyone else is already taken.
— Oscar Wilde.
This is the first post on my new blog. I’m just getting this new blog going, so stay tuned for more. Subscribe below to get notified when I post new updates.
In spo600 course, I took FLIF as my project.
FLIF is a picture format that is able to lossless compress pictures.
There are 3 stages for the project: Benchmarking, Profiling and optimizing.
In the first stage, I found the project and benchmarked the program using the use case that built by my self. If you are interested in that, please go to my previous posts.
To identify the effects of compiler optimization flags, I tried to compile and run the program with different optimization levels by modifying the Makefile.
One thing surprised me was that O3 and Ofast does not provide the fastest performance, O2 does.
Then I moved to second stage, the profiling. In this stage, I found the function that takes most of time to run and tried to understand it.
That was a clean code. It does not contains too much high-end C++ feature, but only used template and class from C++, other codes looks like C code.
That allows me to understand the code easily. After I looked at the code, I thought that it is hard to optimize the code because it is clear enough: there are almost no obvious logic and syntax issues that result in performance issues.
In the final stage, I tried to use multiple-threading to speed-up the program. It actually work. The function that takes most time to run was complete so that it is hard to move it to multiple-threading – actually that logic should not be done with different threading. Just like render a image, each thread should render only one part, instead of one part being rendered by multiple thread. So I cut the image into 4 different fragments and compress the 4 fragments by the program at the same time. the program takes less time in the real.(not the cpu time, the cpu time should be used a little more).
In this lab, I will look at 3 different approaches that deals with audio volume.
This is the 3 approaches that the course provided:
Three approaches to this problem are provided:
1. The basic or Naive algorithm (
vol1.c). This approach multiplies each sound sample by 0.75, casting from signed 16-bit integer to floating point and back again. Casting between integer and floating point can be expensive operations.2. A lookup-based algorithm (
vol2.c). This approach uses a pre-calculated table of all 65536 possible results, and looks up each sample in that table instead of multiplying.3.A fixed-point algorithm (
https://wiki.cdot.senecacollege.ca/wiki/SPO600_Algorithm_Selection_Labvol3.c). This approach uses fixed-point math and bit shifting to perform the multiplication without using floating-point math.
First, I will try to predict which is the fastest one.
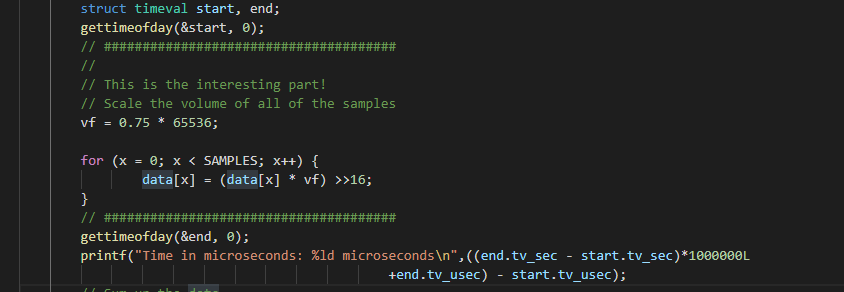
After I looked at all three solutions, I prefer to say solution 3 is the fastest one because it used bitwise operation to make the division.
        for (x = 0; x < SAMPLES; x++) {
                data[x] = (data[x] * vf) >>16;
        }
This will be extremely fast to the CPU, but the accuracy may be affected.
To identify the time of every solution used, I decided to use linux system call to record the time.
Time of sample 500000000 on israel(in microsecond, us):
vol1 1460840
vol2 2579299
vol3 754098
If I ran the programs again, the time will be a little bit different but most likely the differences are very tiny so that we can ignore it.
The reason why there is such differences is that the OS may dealing with other stuff so that the program cannot take 100% CPU resources.
On israel, vol2 is the slowest one. However, when I try to run the same programs on xerxes, vol1 is the slowest one. Maybe the different instruction set resulted in this. vol3 is the fastest on both israel and xerxes.
Memory usage:
I use ‘top’ to monitor the memory usages.


According to the data, the memory usages of the 3 solutions were almost same.
The things that shocks me is that the same code(logic) might have different performance on different architectures. The CPU is general use chip so that it can do all the stuff, but the hardware architecture does affect the program performance. So that if there are some specific usage logic and the code is hard to be optimized, create a architecture that only process this logic may be able to improve the performance effectively.
    for (int i = 0; i < plane_zoomlevels(images[0], beginZL, endZL); i++) {

      std::pair<int, int> pzl = plane_zoomlevel(images[0], beginZL, endZL, i, ranges);
      int p = pzl.first;
      int z = pzl.second;
      if (options.chroma_subsampling && p > 0 && p < 3 && z < 2) continue;
      if (!default_order) metaCoder.write_int(0, nump-1, p);
      if (ranges->min(p) >= ranges->max(p)) continue;
      int predictor = (the_predictor[p] < 0 ? find_best_predictor(images, ranges, p, z) : the_predictor[p]);
      //if (z < 2 && the_predictor < 0) printf("Plane %i, zoomlevel %i: predictor %i\n",p,z,predictor);
      if (the_predictor[p] < 0) metaCoder.write_int(0, MAX_PREDICTOR, predictor);
      if (endZL == 0) v_printf_tty(2,"\r%i%% done [%i/%i] ENC[%i,%ux%u]  ",(int)(100*pixels_done/pixels_todo),i,plane_zoomlevels(images[0], beginZL, endZL)-1,p,images[0].cols(z),images[0].rows(z));
      Properties properties((nump>3?NB_PROPERTIESA[p]:NB_PROPERTIES[p]));
      if (z % 2 == 0) {
        // horizontal: scan the odd rows, output pixel values
          for (uint32_t r = 1; r < images[0].rows(z); r += 2) {
            pixels_done += images[0].cols(z);
            if (endZL == 0 && (r & 257)==257) v_printf_tty(3,"\r%i%% done [%i/%i] ENC[%i,%ux%u]  ",(int)(100*pixels_done/pixels_todo),i,plane_zoomlevels(images[0], beginZL, endZL)-1,p,images[0].cols(z),images[0].rows(z));
            for (int fr=0; fr<(int)images.size(); fr++) {
              const Image& image = images[fr];
              if (image.seen_before >= 0) { continue; }
              uint32_t begin=(image.col_begin[r*image.zoom_rowpixelsize(z)]/image.zoom_colpixelsize(z)),
                         end=(1+(image.col_end[r*image.zoom_rowpixelsize(z)]-1)/image.zoom_colpixelsize(z));
              for (uint32_t c = begin; c < end; c++) {
                    if (alphazero && p<3 && image(3,z,r,c) == 0) continue;
#ifdef SUPPORT_ANIMATION
                    if (FRA && p<4 && image(4,z,r,c) > 0) continue;
#endif
                    ColorVal guess = predict_and_calcProps(properties,ranges,image,z,p,r,c,min,max,predictor);
                    ColorVal curr = image(p,z,r,c);
#ifdef SUPPORT_ANIMATION
                    if (FRA) {
                        if (p==4 && max > fr) max = fr;
                        if (guess>max || guess<min) guess = min;
                    }
#endif
                    assert (curr <= max); assert (curr >= min);
                    coders[p].write_int(properties, min - guess, max - guess, curr - guess);
              }
            }
          }
      } else {
        // vertical: scan the odd columns
          for (uint32_t r = 0; r < images[0].rows(z); r++) {
            pixels_done += images[0].cols(z)/2;
            if (endZL == 0 && (r&513)==513) v_printf_tty(3,"\r%i%% done [%i/%i] ENC[%i,%ux%u]  ",(int)(100*pixels_done/pixels_todo),i,plane_zoomlevels(images[0], beginZL, endZL)-1,p,images[0].cols(z),images[0].rows(z));
            for (int fr=0; fr<(int)images.size(); fr++) {
              const Image& image = images[fr];
              if (image.seen_before >= 0) { continue; }
              uint32_t begin=(image.col_begin[r*image.zoom_rowpixelsize(z)]/image.zoom_colpixelsize(z)),
                         end=(1+(image.col_end[r*image.zoom_rowpixelsize(z)]-1)/image.zoom_colpixelsize(z))|1;
              if (begin>1 && ((begin&1) ==0)) begin--;
              if (begin==0) begin=1;
              for (uint32_t c = begin; c < end; c+=2) {
                    if (alphazero && p<3 && image(3,z,r,c) == 0) continue;
#ifdef SUPPORT_ANIMATION
                    if (FRA && p<4 && image(4,z,r,c) > 0) continue;
#endif
                    ColorVal guess = predict_and_calcProps(properties,ranges,image,z,p,r,c,min,max,predictor);
                    ColorVal curr = image(p,z,r,c);
#ifdef SUPPORT_ANIMATION
                    if (FRA) {
                        if (p==4 && max > fr) max = fr;
                        if (guess>max || guess<min) guess = min;
                    }
#endif
                    assert (curr <= max); assert (curr >= min);
                    coders[p].write_int(properties, min - guess, max - guess, curr - guess);
              }
            }
          }

      }
      if (endZL==0 && io.ftell()>fs) {
          v_printf_tty(3,"    wrote %li bytes    ", io.ftell());
          v_printf_tty(5,"\n");
          fs = io.ftell();
      }

    }
This is the loop that takes most of time of the program. To examine the loop, I need to know the run time of every loop so that I added timer to the beginning and the ending of the loop. the result is that with the increasing of value ‘i’, the loops takes more time.
Just go though the code, the thing that most likely be effected by value ‘i’ is the
std::pair<int, int> pzl = plane_zoomlevel(images[0], beginZL, endZL, i, ranges);
function.
This function returns a std::pair<int, int>. The function signature is:
std::pair<int, int> plane_zoomlevel(const Image &image, const int beginZL, const int endZL, int i, const ColorRanges *ranges)
it returns a std::pair<int, int> and the tried to assign it’s value to a variable. This may cause the copy constructor and copy assignment operator to be called over and over again. To save the time here, we can allocate the memory on the heap and make the function returns a reference or pointer to avoid call copy constructor or copy assignment operator of std::pair;
I tested it, the program speeded up less than 1% so that not a signification part that affecting performance.
The most important part is the inside loop.
      if (z % 2 == 0) {
        // horizontal: scan the odd rows, output pixel values
          for (uint32_t r = 1; r < images[0].rows(z); r += 2) {
            pixels_done += images[0].cols(z);
            if (endZL == 0 && (r & 257)==257) v_printf_tty(3,"\r%i%% done [%i/%i] ENC[%i,%ux%u]  ",(int)(100*pixels_done/pixels_todo),i,plane_zoomlevels(images[0], beginZL, endZL)-1,p,images[0].cols(z),images[0].rows(z));
            for (int fr=0; fr<(int)images.size(); fr++) {
              const Image& image = images[fr];
              if (image.seen_before >= 0) { continue; }
              uint32_t begin=(image.col_begin[r*image.zoom_rowpixelsize(z)]/image.zoom_colpixelsize(z)),
                         end=(1+(image.col_end[r*image.zoom_rowpixelsize(z)]-1)/image.zoom_colpixelsize(z));
              for (uint32_t c = begin; c < end; c++) {
                    if (alphazero && p<3 && image(3,z,r,c) == 0) continue;
#ifdef SUPPORT_ANIMATION
                    if (FRA && p<4 && image(4,z,r,c) > 0) continue;
#endif
                    ColorVal guess = predict_and_calcProps(properties,ranges,image,z,p,r,c,min,max,predictor);
                    ColorVal curr = image(p,z,r,c);
#ifdef SUPPORT_ANIMATION
                    if (FRA) {
                        if (p==4 && max > fr) max = fr;
                        if (guess>max || guess<min) guess = min;
                    }
#endif
                    assert (curr <= max); assert (curr >= min);
                    coders[p].write_int(properties, min - guess, max - guess, curr - guess);
              }
            }
          }
      } else {
        // vertical: scan the odd columns
          for (uint32_t r = 0; r < images[0].rows(z); r++) {
            pixels_done += images[0].cols(z)/2;
            if (endZL == 0 && (r&513)==513) v_printf_tty(3,"\r%i%% done [%i/%i] ENC[%i,%ux%u]  ",(int)(100*pixels_done/pixels_todo),i,plane_zoomlevels(images[0], beginZL, endZL)-1,p,images[0].cols(z),images[0].rows(z));
            for (int fr=0; fr<(int)images.size(); fr++) {
              const Image& image = images[fr];
              if (image.seen_before >= 0) { continue; }
              uint32_t begin=(image.col_begin[r*image.zoom_rowpixelsize(z)]/image.zoom_colpixelsize(z)),
                         end=(1+(image.col_end[r*image.zoom_rowpixelsize(z)]-1)/image.zoom_colpixelsize(z))|1;
              if (begin>1 && ((begin&1) ==0)) begin--;
              if (begin==0) begin=1;
              for (uint32_t c = begin; c < end; c+=2) {
                    if (alphazero && p<3 && image(3,z,r,c) == 0) continue;
#ifdef SUPPORT_ANIMATION
                    if (FRA && p<4 && image(4,z,r,c) > 0) continue;
#endif
                    ColorVal guess = predict_and_calcProps(properties,ranges,image,z,p,r,c,min,max,predictor);
                    ColorVal curr = image(p,z,r,c);
#ifdef SUPPORT_ANIMATION
                    if (FRA) {
                        if (p==4 && max > fr) max = fr;
                        if (guess>max || guess<min) guess = min;
                    }
#endif
                    assert (curr <= max); assert (curr >= min);
                    coders[p].write_int(properties, min - guess, max - guess, curr - guess);
              }
            }
          }

      }
This takes most of the time.
The code is simple enough so that it is hard to improve the performance by dealing with the code.
However, there are still some other’s way to improve the performance.
The program run on only one thread, so that the CPU frequency is the most important part which affecting performance.
So optimize it, we can cut the picture into frags and run multiple instances at the same time.
Let’s think about this script.
#include <thread>
#include <stdlib.h>
#include <iostream>
#include <string>
#include "timer.h"
using namespace std;

void func(int i){
    Timer t;
    std::string cmd = "./flif test4k"+to_string(i)+".png out" + to_string(i) +".flif";
    t.reset();
    t.start();
    system(cmd.c_str());
    t.stop();
    cout << i << " finished in " << t.currtime() << endl;
}

int main(){
    Timer t;
    t.start();
    std::thread t1(func, 1);
    std::thread t2(func, 2);
    std::thread t3(func, 3);
    std::thread t4(func, 4);
    t1.join();
    t2.join();
    t3.join();
    t4.join();
    t.stop();
    cout << "finished in " << t.currtime() << endl;
    //combine picture;
    //need another program to finish this operation
    //...
}
I cut an 8K picture into four 4K pictures, and try to run four FLIF program to cut the four picture at the same time.
If the machine contains 4 psychical cores, the program should be finished with time that is similar as compressing a 4K picture.
The result is:
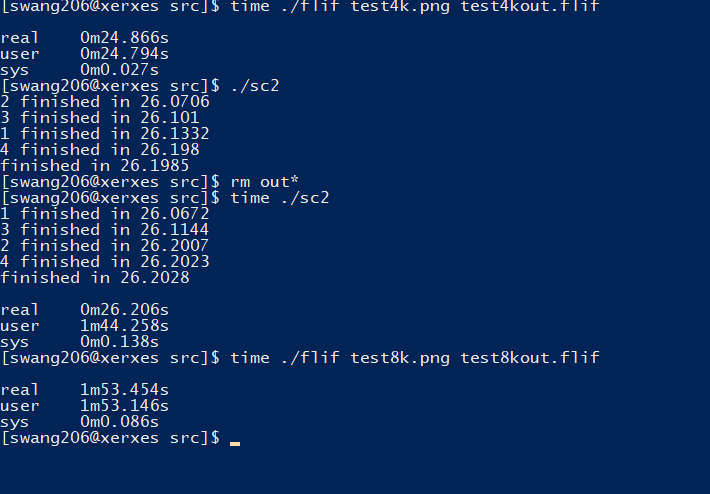
This is actually much faster than previous and match our prediction.
Because this is a lossless compression software so that there are no problems like the issue of calculating the pixel value at the edge of the picture if we cut one picture into fragments and combine them.
Conclusion:
This is my project of SPO600, improving the performance of this open source software. What I learned from the project is that, we should consider the optimization level as early as possible so that the cost of modifying code will not be unacceptable. Also, multiple threading is another effective tool to improve the CPU sensitive programs.
I will post a conclusion post later.
Introduction
In this stage, I will try to find out with function takes most CPU resources and see if there is possibility to reduce the runtime without effect or with a tiny effect to the output.
I choose “gprof” as the profiler on Linux machine. The reason why I choose it is that it gives me a option to see the call times of the function.
First, I need to add -pg argument when I am compiling the program:
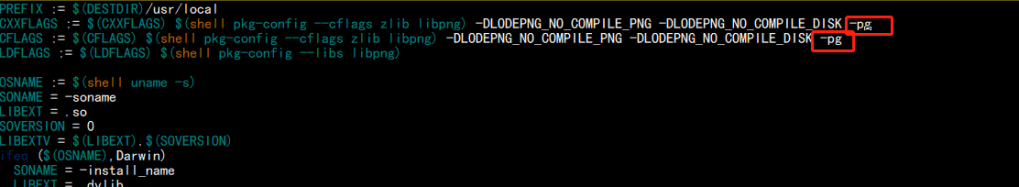
This allows “gprof” to count the call times of the function calls.
Then I compile and run the program, I get a file called “gmon.out”.
Run “gprof flif gmon.out > result.txt”, I redirect the output of the result to the file so I can clearly see the report:
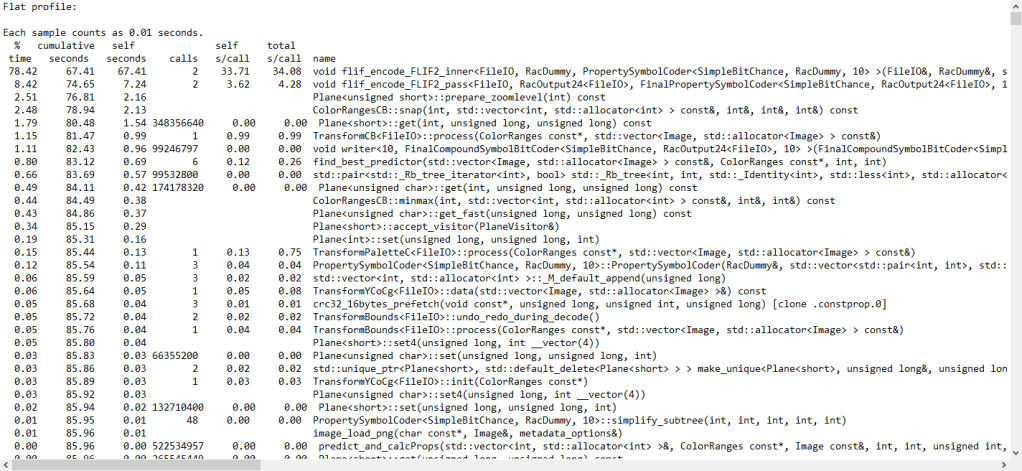
In FLIF project, most of CPU time of costed by encode functions: flif_encode_FLIF2_inner and void flif_encode_FLIF2_pass
They take approximately 87% of the run time when I try to compress a 8K image.
Then I locate the function and see how it works.
This function contains many nested loops and run the loop in a single thread. This could be a point that how can I speed up the project – multiple threading and inline assembly.
In the last blog, we finished the program that prints “Hello World” 30 times on Aarch64 machine, now we are going to code the same program on X86_64 machine using assembly language.
Step 1: start with a basic hello world program
.text
.globl  _start

_start:
        movq    $len,%rdx                       /* message length */
        movq    $msg,%rsi                       /* message location */


        movq    $1,%rdi                         /* file descriptor stdout */
        movq    $1,%rax                         /* syscall sys_write */
        syscall

        movq    $0,%rdi                         /* exit status */
        movq    $60,%rax                        /* syscall sys_exit */
        syscall


.section .data
msg:    .ascii      "Hello, world!: 0\n"
        len = . - msg
Step 2: loop 30 times output
.text
.globl	_start

_start:
	movb 	$'0', %r12b
	movq	$min, %r10

loop:

	movq	%r10, %r9
	movq	$len,%rdx			/* message length */
	movq 	$msg,%rsi			/* message location */

	movq 	$msg+15, %r11
	movb 	%r12b, (%r11)

	movq	$1,%rdi				/* file descriptor stdout */
	movq	$1,%rax				/* syscall sys_write */
	syscall

	inc		%r12b

	inc		%r10
	cmp		$max, %r10
	jne		loop

	movq	$0,%rdi				/* exit status */
	movq	$60,%rax			/* syscall sys_exit */
	syscall


.section .data
msg:	.ascii      "Hello, world!: 0\n"
	len = . - msg
min = 0
max = 30
division = 10
Step 3: deal with the second digit output
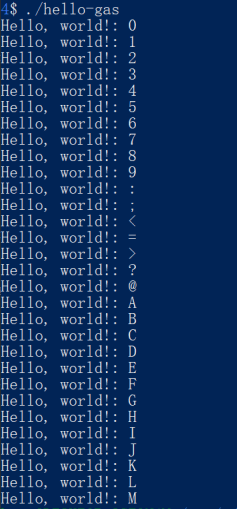
Now the already looped the output 30 times, but the we have not dealt with second digit output, so the output is :
On X86_64 machine, getting reminder is a little different:
        movq    $0, %rdx         /*initialize rdx to 0 for division*/
        movq    %r10, %rax     /*store the r10 value into rax for division*/
        div     %r9              /*divide rax value by 10(r9)*/

        movq    %rax, %r14    /*store the rax value(quotient) into r14*/
        movq    %rdx, %r15    /*store the rdx value(remainder) int r15*/
After dividing, the quotient and remainder will be stored into rax and rdx.
Lab 5 on X86_64
.text
.globl  _start

_start:
        movq    $min, %r10      /*store the min vlaue into r10 as a loop index*/
        movq    $division, %r9   /*store the division value(10) into r9*/

loop:
        cmp     %r9, %r10      /*compare r10(loop index) with 10*/
        jl      digit_1          /*if r10 is less than 10, go to the subroutine digit_1*/
        jmp     digit_2          /*if r10 is greater or equal to 10, go to the subroutine digit_2*/


digit_1:
        movq    %r10, %r15      /*store the r10 value into r15*/
        add     $'0', %r15       /*add '0' to r15 so the value will be ascii number character value*/

        movq    $msg+15, %r11   /*the digit location within string*/
        movb    %r15b, (%r11)   /*store the digit at the location*/

        jmp     print           /*go to the subroutine print*/

digit_2:
        movq    $0, %rdx         /*initialize rdx to 0 for division*/
        movq    %r10, %rax     /*store the r10 value into rax for division*/
        div     %r9              /*divide rax value by 10(r9)*/

        movq    %rax, %r14    /*store the rax value(quotient) into r14*/
        movq    %rdx, %r15    /*store the rdx value(remainder) int r15*/

        add     $'0', %r14       /*add '0' to r14 so the value will be ascii number character value*/
        add     $'0', %r15       /*add '0' to r15 so the value will be ascii number character value*/

        movq    $msg+14, %r11   /*the digit location within string*/
        movb    %r14b, (%r11)   /*store the digit at the location*/

        movq    $msg+15, %r12   /*the digit loctaion within string*/
        movb    %r15b, (%r12)   /*store the digit at the location*/

        jmp     print   /*go to the subroutine print*/


print:
        movq    $len,%rdx                       /* message length */
        movq    $msg,%rsi                       /* message location */


        movq    $1,%rdi                         /* file descriptor stdout */
        movq    $1,%rax                         /* syscall sys_write */
        syscall
        inc             %r12b

        inc             %r10      /*increment loop index*/
        cmp             $max, %r10  /*compare the max with r10*/
        jne             loop      /*if the max value and the r10(loop index) value is not equal,*/
                                  /*   redo the loop subroutine*/

        movq    $0,%rdi                         /* exit status */
        movq    $60,%rax                        /* syscall sys_exit */
        syscall


.section .data
msg:    .ascii      "Hello, world!:   \n"
        len = . - msg
min = 0
max = 30
division = 10
In X86 part, I encountered many seg faults. To deal with that, I tried to use gdb to deal with that. But unfortunately, the gdb barely gives me useful information.
I will write another blog to describe how to use gdb to debug assembly code.
In Lab 5, we will try to disassembly some C programs to look at how their assembly code is generated, and write a simple “Hello Word” program using assembly language.
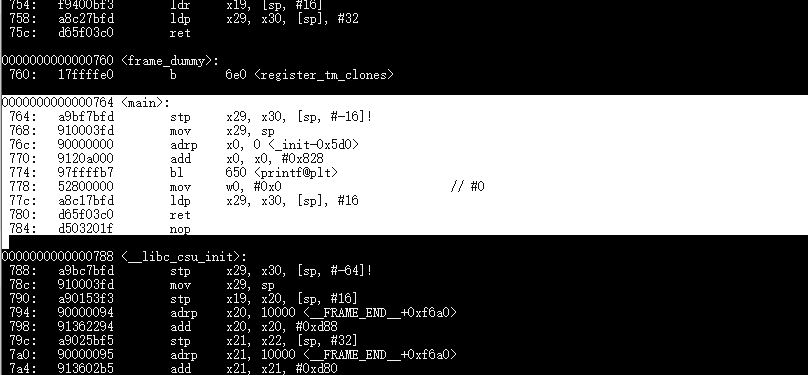
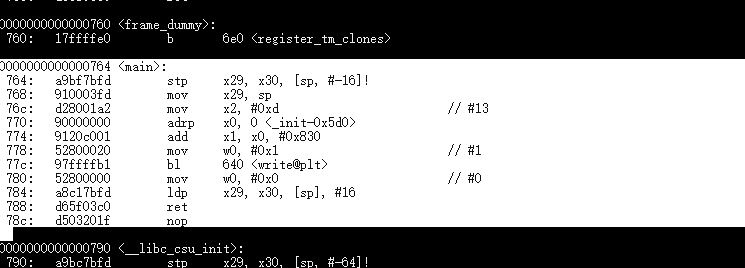
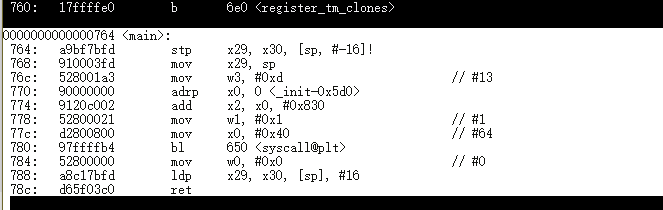
Disassembly hello programs on Aarch64 machine
The <main> section is the code that inside of int main(){…}
hello:
hello2:
hello3:
Lab 5 on Aarch64
step 1: we need a program which is able to print “Hello Word”
.text
.globl _start
_start:

        mov     x0, 1           /* file descriptor: 1 is stdout */
        adr     x1, msg         /* message location (memory address) */
        mov     x2, len         /* message length (bytes) */

        mov     x8, 64          /* write is syscall #64 */
        svc     0               /* invoke syscall */

        mov     x0, 0           /* status -> 0 */
        mov     x8, 93          /* exit is syscall #93 */
        svc     0               /* invoke syscall */

.data
msg:    .ascii      "Hello, world!\n"
len=    . - msg
We are on Linux, so we need to perform system call “write” to output “Hello World” to screen.
write prototype:
ssize_t write(int fd, const void *buf, size_t count);
We can see the write function has 3 parameters: file descriptor, a pointer that points to where the data is in the memory, and the length of the data.
We declared a message in .data section and calculated the length of the message. Now we have all the data we need to perform “write” system call.
We move 1(stdout) to x0 as file descriptor, move address of msg to x1 as the pointer of the buffer, and len to x2 as the length of the message.
After all, we need to indicate the system call number to x8, which should be 64(write) here.
svc 0 to invoke the system call on Aarch64.
Now we can see the message “Hello World” on the screen.
After the output, we need to exit the program, so we performed another system call – exit. the parameter is 0.
Step 2:
We need to loop the output 30 times
.text

.globl _start


_start:

        mov     x19,min

loop:
        mov     x0, 1           /* file descriptor: 1 is stdout /
        adr     x1, msg         / message location (memory address) /
        mov     x2, len         / message length (bytes) /

        mov     x8, 64          / write is syscall #64 /
        svc     0               / invoke syscall /

        add     x19, x19, 1
        cmp     x19, max
        b.ne    loop

        mov     x0, 0           / status -> 0 /
        mov     x8, 93          / exit is syscall #93 /
        svc     0               / invoke syscall */


.data
msg:    .ascii      "Hello, world!\n"
len=    . - msg
min = 0
max = 30
We indicated a counter in x19, and loop the out put until the counter is max, which is 30.
Step 3: print the digits
For the first 10 loops is easy, we just need to output the char 0-9, which are 30-39 in ascii code.
add x20, x19, 30then print it to the screen by replacing the char at 14th char of msg.
        adr     x30, msg+14
        strb    w20, [x30]
But the problem is print 10-30. We need to deal with the second digit:
        udiv    x25, x19, x18
        msub    x26, x25, x18, x19
We store 10 in x18, and divide the number by 10, then store the remainder in x26. Then we can use the way that we display the 1-digit number to display 2-digit number.
Lab 5 on Aarch64:
.text
.globl _start

_start:
        mov     x19,min         /*store the min value into x19 as a loop index*/
        mov     x18,division    /*store the division value(10) into x18*/
loop:
        mov     x0, 1           /* file descriptor: 1 is stdout */

        cmp     x19, 9          /* compare x19(loop index value) with 9*/
        b.gt    digit_2         /* if the value is greater than 9(2-digit), go to the subroutine digit_2*/
        bl      digit_1         /* if the value is less or equal than 9(1-digit), go to the subroutine digit_1*/

digit_1:
        add     x20, x19, '0'   /* ascii number character*/

        adr     x30, msg+14     /* the digit location within string */
        strb    w20, [x30]      /* store the digit at the location */
        bl      print           /* go to the print subroutine */


digit_2:
        udiv    x25, x19, x18   /* divide the value by 10 and store the value into the x25 */
        msub    x26, x25, x18, x19 /* store the remainder into x26 */

        add     x21, x25, '0'   /* ascii number character */
        add     x20, x26, '0'   /* ascii number character */

        adr     x25, msg+14     /* the digit location within string */
        strb    w21, [x25]      /* store the digit at the location */
        adr     x26, msg+15     /* the digit location within string */
        strb    w20, [x26]      /* store the digit at the location */

        bl      print

print:
        adr     x1, msg         /* store the locatio of message */
        mov     x2, len         /* store the string length into x2 */

        mov     x8, 64          /* write is syscall #64 */
        svc     0               /* invoke syscall */

        add     x19, x19, 1     /* increment x19 value which is loop index */
        cmp     x19, max        /* compare x19 with max value */

        b.ne    loop            /* if the value is not equal to max value, loop it again */

        mov     x0, 0           /* status -> 0 */
        mov     x8, 93          /* exit is syscall #93 */
        svc     0               /* invoke syscall */

.data
msg:    .ascii      "Hello World!:   \n"
len= .- msg
min = 0
max = 30
division=10
After we finished the program on Aarch64, we will code the program again on x86_64
Project: FLIF
https://github.com/FLIF-hub/FLIF
“
FLIF is a lossless image format based on MANIAC compression. MANIAC (Meta-Adaptive Near-zero Integer Arithmetic Coding) is a variant of CABAC (context-adaptive binary arithmetic coding), where the contexts are nodes of decision trees which are dynamically learned at encode time.
FLIF outperforms PNG, FFV1, lossless WebP, lossless BPG and lossless JPEG2000 in terms of compression ratio.
Moreover, FLIF supports a form of progressive interlacing (essentially a generalization/improvement of PNG’s Adam7) which means that any prefix (e.g. partial download) of a compressed file can be used as a reasonable lossy encoding of the entire image.
For more information on FLIF, visit https://flif.info
“
To profile the project, I decided to write a script to store the run time.
I used Linux system calls record the run time of the program. To control the variables that may affect the run time and to get a more accurate time, I run the program 5 times and get the average run time of the 5 as the run time of the program.
To build a benchmark test case that is able to take 4 minutes, I created a 4k, 8k, and 16k picture as the test samples.
The result of 8k image on Xerxes server:
./flif test8k.png out.flif
Run 1/5 time: 112.959
Run 2/5 time: 113.265
Run 3/5 time: 113.794
Run 4/5 time: 112.956
Run 5/5 time: 113.011
Avg: 113.197
Then I need to run the test using the sample that I created on different optimization level. Therefore, fixing the test script is needed.
First, I created 4 different Makefile to allow my script to build the program with different optimization level:
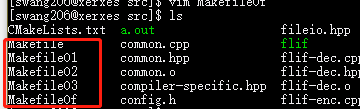
Then in my script, after every test case, I just clean and compile it again, then run the test case.
To test the script, I selected a small image as a sample.
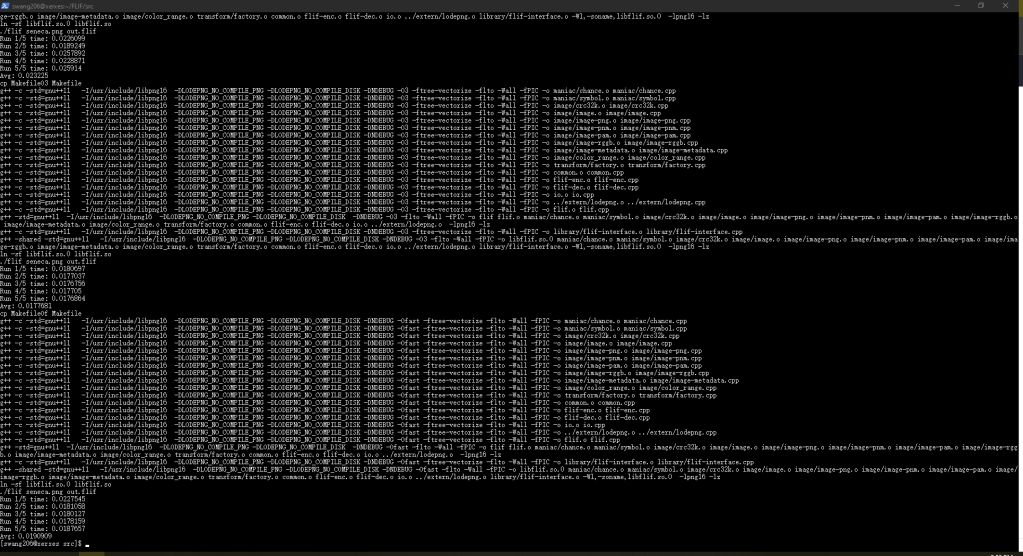
Seems like it works well. Then I just need to modify the script to keep only the output that I need – the times and some other critical information.
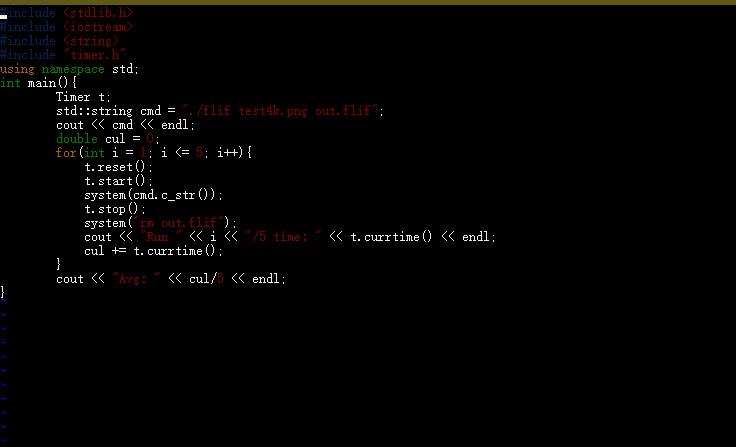
The script code is:
#include <stdlib.h>
#include <iostream>
#include <string>
#include "timer.h"
using namespace std;
int main(){
	Timer t;
	system("make clean > /dev/null"); //useless output
	std::string cmd = "./flif seneca.png out.flif";
	int c = 0;
test:
	string builds[4] = {string("cp MakefileO1 Makefile"), string("cp MakefileO2 Makefile"), string("cp MakefileO3 Makefile"), string("cp MakefileOf Makefile")};
	cout << builds[c] << endl;
	system((string(builds[c]) + string(" > /dev/null")).c_str()); //useless output
	system("make all >> buildinfo.txt");//record the build info into a file to log the building procedure
	cout << cmd << endl;
	double cul = 0;
	for(int i = 1; i <= 5; i++){
            t.reset();
	    t.start();
	    system(cmd.c_str());
	    t.stop();
	    system("rm out.flif");
	    cout << "Run " << i << "/5 time: " << t.currtime() << endl;
	    cul += t.currtime();
	}
	cout << "Avg: " << cul/5 << endl;
	system("make clean > /dev/null"); //useless output
	c++;
	if(c != 4) goto test;
}
output:
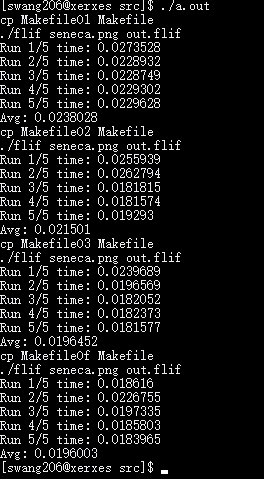
Finally, I just need to use the correct sample image and redirect the output into a file, then I can do others staff.
./swtest.out > 8k_result.txtThis blog will be updated when I get the result on both Xerxes server(x86) and Israel(AArch86).
Result on Xerxes(8K Image):
O1:
Run 1/5 time: 136.447
Run 2/5 time: 136.021
Run 3/5 time: 136.356
Run 4/5 time: 136.181
Run 5/5 time: 136.28
Avg: 136.257
O2:
Run 1/5 time: 113.303
Run 2/5 time: 113.05
Run 3/5 time: 113.058
Run 4/5 time: 113.007
Run 5/5 time: 113.434
Avg: 113.17
O3:
Run 1/5 time: 115.2
Run 2/5 time: 115.248
Run 3/5 time: 115.254
Run 4/5 time: 115.537
Run 5/5 time: 115.56
Ofast
Run 1/5 time: 114.524
Run 2/5 time: 114.434
Run 3/5 time: 114.959
Run 4/5 time: 114.584
Run 5/5 time: 114.871
Avg: 114.675
Result on Israel:
O1:
Run 1/5 time: 480.112
Run 2/5 time: 482.835
Run 3/5 time: 487.211
Run 4/5 time: 481.755
Run 5/5 time: 486.157
Avg: 483.614
O2:
Run 1/5 time: 342.601
Run 2/5 time: 343.368
Run 3/5 time: 343.536
Run 4/5 time: 343.573
Run 5/5 time: 350.155
Avg: 344.647
O3:
Run 1/5 time: 354.89
Run 2/5 time: 358.898
Run 3/5 time: 359.501
Run 4/5 time: 354.217
Run 5/5 time: 349.274
Avg: 355.356
Ofast:
Run 1/5 time: 351.706
Run 2/5 time: 350.837
Run 3/5 time: 345.919
Run 4/5 time: 350.003
Run 5/5 time: 346.357
Avg: 348.964
According to the result, the optimization level affects the runtime of the program.
Usually, the O3 is the fastest optimization level, but in this testing case, the O2 and O3 does not have big differences.
Compiler bootstrapping means that the a compiler is coded by it’s own language.
For example, a C compiler may write in C.
??????????????????
This is an Chicken-And-Egg question right???
Where is the first version of the language’s complier from? More exactly, which language implemented first Compiler?
No question, it is written in Machine Code.
After that, we can use a coding language to program the computers. After we got the first compiler of a language, for example, first version of C compiler, we will be able to compile C code, and we can write another C compiler using C, and write a better C compiler base on the compiler we have.
For example:
I have a compiler call mcc, all c code compiler by mcc is 100% faster than gcc. How can I make it work?
First, I need to compile my mcc source code using gcc, so I have mcc 1.0.
All code that compiled by mcc is faster than gcc. So C programs 100 faster!
Is that end? Using mcc to compile code is still slow be cause mcc 1.0 is compiled by gcc. we know that C code that compiled by mcc runs faster, so what if I compiler mcc source code again using mcc1.0?
Yes! mcc 2.0(by mcc 1.0) runs faster 100% than mcc 1.0(by gcc)!
This is compiler bootstrapping.
Nowadays, we have so many great coding languages so seems like there is no reason to implement a compiler using it’s own language?
Well there are many reasons to do that.
When a new language is innovated, people need to validate that the language is easy to use.
Bootstrapping is a validation. Also, Bootstrapping helps the innovator to improve their languages to make it better.
But this does not means that the all common compiler are bootstrapped.
For example: Python and Java.
Python is a bootstrapped language, there is a Python implementation called PyPy. But most of people are using CPython(Implemented by C). The reason is efficiency. Also, Java Virtual Machine also has a Java implemented version, but it is barely used.
However, bootstrapping is still necessary to a language because it is able to validate the language and helps the language to be improved!
Lab 3 Code:
define 	POINTER         $10
define 	POINTER_H	$11
define 	ROW_COUNT 	$13
define 	ROW          	$14
define 	COLUMN  	$15
define	CHECK_LINE	$16
define	ROWFLIP_FLAG	$17
define	COLFLIP_FLAG	$18
define	PTR_CALCULATE	$19
define	DATA_INDEX	$20
define	SCREENCOL_INDEX	$21
define	KEY		$22

define	WIDTH		5
define	HEIGHT		5

 	lda  	#$04          	; Set a row value 1f
 	sta 	ROW
 	lda 	#$04		; Set a column value 5
 	sta 	COLUMN

	lda	#$00
	sta	ROWFLIP_FLAG
	sta	COLFLIP_FLAG

; ====== Calculation ======
; ====== Initialize for calculation ======
cal_initialize:

 	lda 	#$00  		; create a pointer at $10
 	sta 	POINTER
 	lda 	#$02
 	sta 	POINTER_H

	lda	#$00
	sta	ROW_COUNT

	lda	#$00
	sta	PTR_CALCULATE

	cmp	ROW
	beq	column_count
	bne	row_count

;====== row count =======
row_count:
	lda	PTR_CALCULATE
	clc
	adc	#$20
	sta	PTR_CALCULATE

	lda	POINTER_H
	adc	#$00
	sta 	POINTER_H

	inc	ROW_COUNT

	lda	ROW
	cmp	ROW_COUNT
	bne	row_count
	beq	column_count

;===== column_count =====
column_count:
 	lda	PTR_CALCULATE
 	clc
 	adc 	COLUMN
	sta	PTR_CALCULATE

;===== store the value to pointer (calculation done) =====
 	sta 	POINTER

;===== draw graphic =====
; initializing for drawing graph
	lda	#$00
	sta	ROW_COUNT

	ldx	#$00		; index for data
	ldy	#$00		; index for screen column

; draw graph
draw:	lda	ball,x

	sta	(POINTER),y

	inx
	iny
	cpy	#WIDTH
	bne	draw

	inc	ROW_COUNT

	lda	#HEIGHT
	cmp	ROW_COUNT
	beq	getkey_initialize

	lda	POINTER
	clc
	adc	#$20
	sta	POINTER
	lda	POINTER_H
	adc	#$00
	sta	POINTER_H

	ldy	#$00
	beq	draw

; ======= get key =======
getkey_initialize:
	txa
	sta	DATA_INDEX
	tya
	sta	SCREENCOL_INDEX
getkey:	lda 	$ff		; get a keystroke

	ldx	#$00	; clear out the key buffer
	stx	$ff


 	cmp 	#$80	; if not a cursor key, ignore
 	bmi 	getkey_done
 	cmp 	#$84
 	bpl 	getkey_done

 	cmp 	#$80		; check key == up
 	bne 	check1

 	dec 	ROW		; ... if yes, decrement ROW
 	jmp 	getkey_done

 check1:
	cmp 	#$81		; check key == right
 	bne 	check2

 	inc 	COLUMN  	; ... if yes, increment COL
 	jmp 	getkey_done

 check2:
	cmp 	#$82		; check if key == down
 	bne 	check3

 	inc 	ROW		; ... if yes, increment ROW
 	jmp 	getkey_done

 check3:
	cmp 	#$83		; check if key == left
 	bne 	getkey_done

 	dec 	COLUMN  	; ... if yes, decrement COL
 	clc
 	bcc 	getkey_done

getkey_done:
	ldx	DATA_INDEX
	ldy	SCREENCOL_INDEX
	jmp	check_location

; ======= Check the location ======
check_location:
	jsr 	check_top
	jsr	check_bottom
	jsr	check_right
	jsr 	check_left
	jsr	move_pointer

check_initialize:
	lda	#$00
	sta	CHECK_LINE
	rts

check_top:
	jsr	check_initialize
	lda	ROW
	cmp	#$01
	lda	CHECK_LINE
	adc	#$00
	cmp	#$00
	beq	flip_rowFlag
	rts

check_bottom:
	jsr	check_initialize
	lda	ROW
	cmp	#$1b
	lda	CHECK_LINE
	adc	#$00
	cmp	#$01
	beq	flip_rowFlag
	rts

check_left:
	jsr	check_initialize
	lda	COLUMN
	cmp	#$01
	lda	CHECK_LINE
	adc	#$00
	cmp	#$00
	beq	flip_colFlag
	rts

check_right:
	jsr	check_initialize
	lda	COLUMN
	cmp	#$1b
	lda	CHECK_LINE
	adc	#$00
	cmp	#$01
	beq	flip_colFlag
	rts

; ======= Flip Row Flag ======
flip_rowFlag:
	lda	ROWFLIP_FLAG
	cmp	#$00
	beq	inc_rowFlag
	bne	dec_rowFlag
	rts

inc_rowFlag:
	inc	ROWFLIP_FLAG
	rts

dec_rowFlag:
	dec	ROWFLIP_FLAG
	rts


; ======= Flip Col Flag ======
flip_colFlag:
	lda	COLFLIP_FLAG
	cmp	#$00
	beq	inc_colFlag
	bne	dec_colFlag
	rts

inc_colFlag:
	inc	COLFLIP_FLAG
	rts

dec_colFlag:
	dec	COLFLIP_FLAG
	rts

; ======= move the graph ========
move_pointer:
	jsr	row_check
	jsr	col_check
	jmp	clear

row_check:
	lda	ROWFLIP_FLAG
	cmp	#$01
	beq	dec_row
	bne	inc_row

col_check:
	lda	COLFLIP_FLAG
	cmp	#$01
	beq	dec_col
	bne	inc_col

inc_row:
	inc	ROW
	rts

dec_row:
	dec	ROW
	rts

inc_col:
	inc	COLUMN
	rts

dec_col:
	dec	COLUMN
	rts

; ======= move the graph =======
;move:	inc	ROW
;	inc	COLUMN

; ======= clear the screen before redraw the graph =====
clear:	lda	ball
	sta	POINTER
	lda	#$02
	sta	POINTER_H

	ldy	#$00
	tya

clear_loop:
	sta	(POINTER),y
	iny
	bne	clear_loop

	inc	POINTER_H
	ldx	POINTER_H
	cpx	#$06
	bne	clear_loop

	jsr 	cal_initialize

; data constant byte
ball:
 dcb 00,03,03,03,00
 dcb 07,00,00,00,07
 dcb 07,00,00,00,07
 dcb 07,00,00,00,07
 dcb 00,03,03,03,00
The lab we created a shape that will bounce around the screen.
To do this, we created a x/y coordinator location function to locate the screen using X and y:
code:
get_ptr:
	lda row
	sta counter
start:
	lda counter
	cmp #$00
	beq draw_return
	ldy counter
	dey
	sty counter
	lda index
	clc
	adc #$20
	sta index
	bcs increase_page
	jmp start

draw_return:
	clc
	lda index
	adc col
	sta index
	lda #$00
	clc
	clv
	sta counter
	rts

increase_page:
	inc page
	jmp start
This function takes col and row as X and Y value. After processed, it stores the pointer that point to the address that is map to the screen pixel to index and page.
By using this function, we are able to locate a pixel on the screen using X and Y coordinator value.
After we can locate a pixel on the screen, we need to make the pixel move around the screen.
Code:
move:
	jsr slower
	lda x_flag
	cmp #$00
	bne dec_col
	inc col
	lda col
	cmp #$1a
	bne goon
	jsr set_x_flag
	jmp goon
dec_col:
	dec col
	lda col
	cmp #$00
	bne goon
	jsr clr_x_flag
	jmp goon
goon:
	lda y_flag
	cmp #$00
	bne dec_row
	inc row
	lda row
	cmp #$1a
	bne done_mv
	jsr set_y_flag
	jmp done_mv
dec_row:
	dec row
	lda row
	cmp #$00
	bne done_mv
	jsr clr_y_flag
	jmp done_mv
done_mv:
	jsr backup_ptr
	jsr reset_ptr
	jsr get_ptr
	jsr clr_px_at_backup_ptr
	lda #$00
	sta row_counter
	ldy #$00
	ldx #$00
	lda page
	sta draw_page
	lda index
	sta draw_index
	jsr draw

	jmp move
        brk
This function simply increase or decrease the X and Y value. We have 2 indicators to indicate if the X or Y needs to be increased or decreased. After the pixel reaches the edge of the screen, we reverse the indicators
After we got this 2 functions, we almost got the lab!
We just draw the shape from pixel, then clear the screen, and move the pixel, then draw it again. finally, we got the code that we have at the beginning of the blog
Think about a situation, program A wants to send an message to screen.
As we know, the modern CPUs are running on protected mode, which means that program A is not able to perform that task by itself – program A cannot access the hardware, OS, other program memory area, etc.
To finish this task, the program needs some help from the OS, which is able to access hardware, or has the fully control of the CPU so that enables the CPU to work in non-protected mode.
Here is helloworld.c:
#include <stdio.h>
int main(){
    printf("hello world!");
    return 0;
}
The program send “hello world!” to the screen.
To do this, it invoked a function called printf() from c standard library.
But is that possible that we can send a message without using printf(), or without including <stdio.h>?
/* Hello World with a direct write to stdout (file descriptor 1) */

#include <unistd.h>

int main() {
	write(STDOUT_FILENO,"Hello World!\n",13);
}
This still works.
We write “Hello world!” to STDOUT_FILENO, which is 1 in Linux. In this case, we give our string to Linux system, can Linux put this string in a file of STDOUT_FILENO. Linux monitoring the STDOUT_FILENO, if there is anything in there, the system just print it to screen.
But, more directly?
#include <unistd.h>
#include <sys/syscall.h>

int main() {
	syscall(__NR_write,1,"Hello World!\n",13);
}
This still works!
Here, we performed a system call. When system received the system call, the system will do the same thing that it did for us during the last example.
but we still included some libraries.
Is there any possible that we can do it without including any libraries?
int main() {
   char* c = "HELLO WORLD!\n";
   int len = 13;
   int result = 0;
   register int    syscall_no  asm("rax") = 1;
   register int    arg1        asm("rdi") = 1;
   register char*  arg2        asm("rsi") = c;
   register int    arg3        asm("rdx") = 14;
   __asm__ volatile(
      "syscall" :
      "=a" (result)
   );
}
This is it.
We did not include any libraries, but it still output HELLO WORLD to screen. This time, can we say that our program directly output the string to the screen?
The answer is no.
If we analysis the program, we can see there is a word: syscall.
After we passed the necessary information to the registers, we performed a system call.
In this case, the CPU still moves the control from our program to the Linux system.
How? We did not tell the CPU to do anything with Linux system involved.
In fact, the relationship between CPU and the system is created when the system is booting.
Before the CPU enters protected mode, the Linux system tells the CPU a table that contains many system calls.
In the table, read() is 0, write() is 1.(X86_64)
when the CPU execute system call, the CPU get a number from %rax, then the CPU open the table that it got when the system is booting.
In %rax is 1, CPU found it in the table, it is write()! Then the CPU move the control to the system, execute the code of write() that provided by the system. After it’s done, the system move the control of CPU back to our program!
In other word, the system call is a bridge between our program and other program area. If our program want’s to access other memory, the program can only perform system calls and the system calls follows the pre-defined behaviors.
This how the CPUs and Memory protected our PCs.
